
- Analysis of Shopping Cart Data
This project seeks to apply Data Analysis skills to a shopping cart dataset of Australian State.
To install the project, it is advisable to use a virtual enviroment, installing all dependencies in the requirementes.txt
To execute, simply run the project main with the command:
python3 main.py
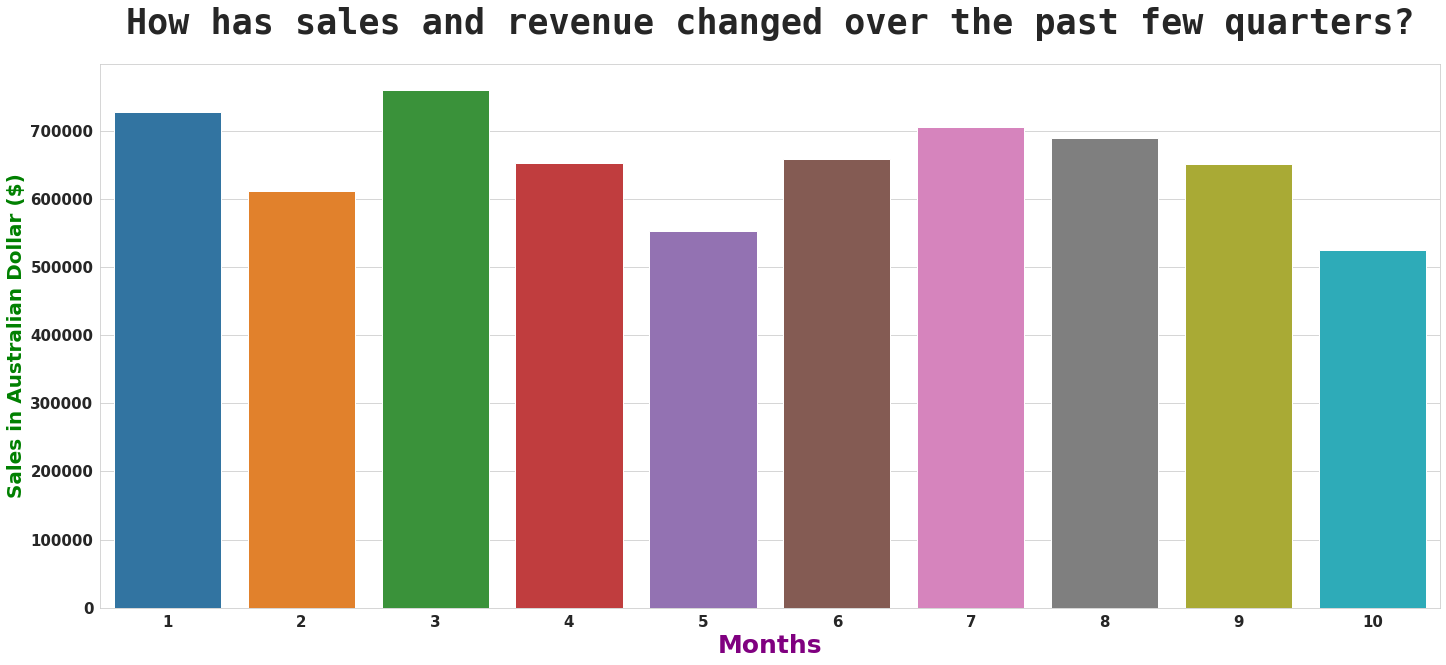
Summary of the data set so far. These are some points we have:
-
Customer Order and product data:
- We have a total of 1000 rows and 22 columns
- There are no missing values
- customer_name: 1000 uniqueness variable(s)
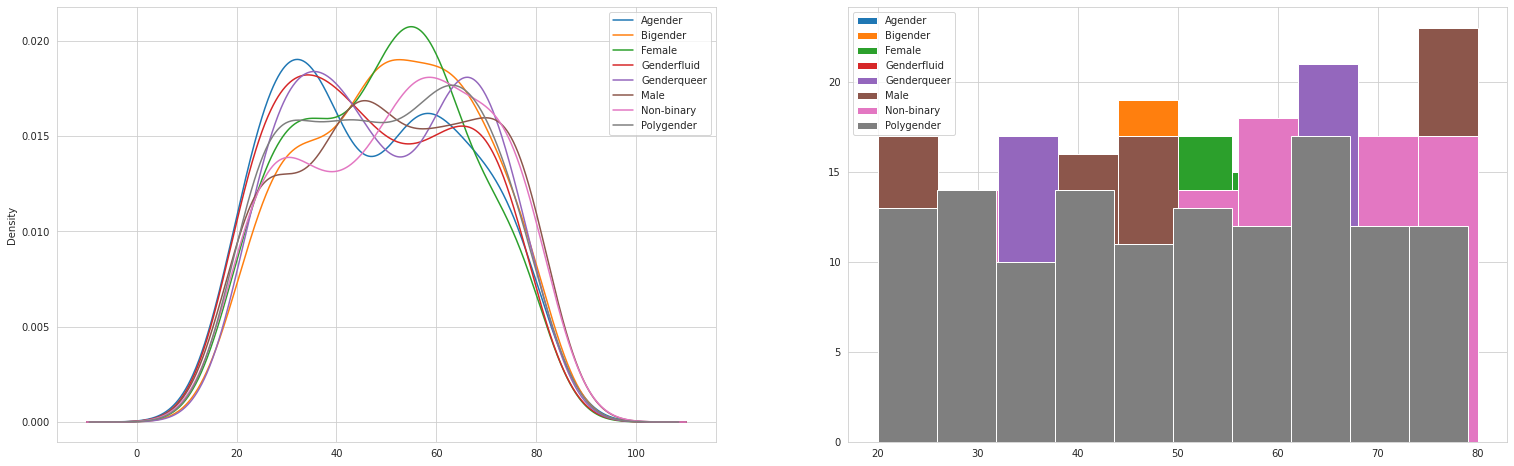
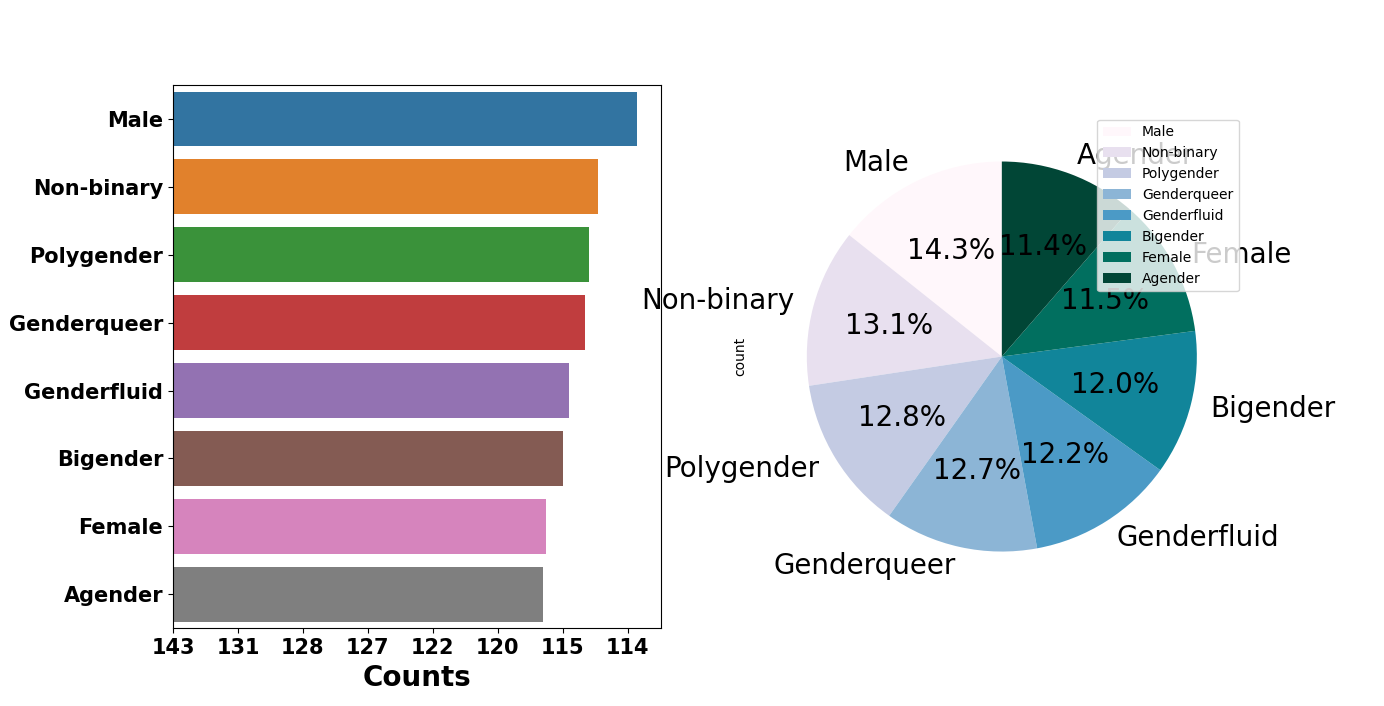
- gender : 8 uniqueness variable(s)
- home_address : 1000 variable(s) of uniqueness
- city : 961 variable(s) of uniqueness
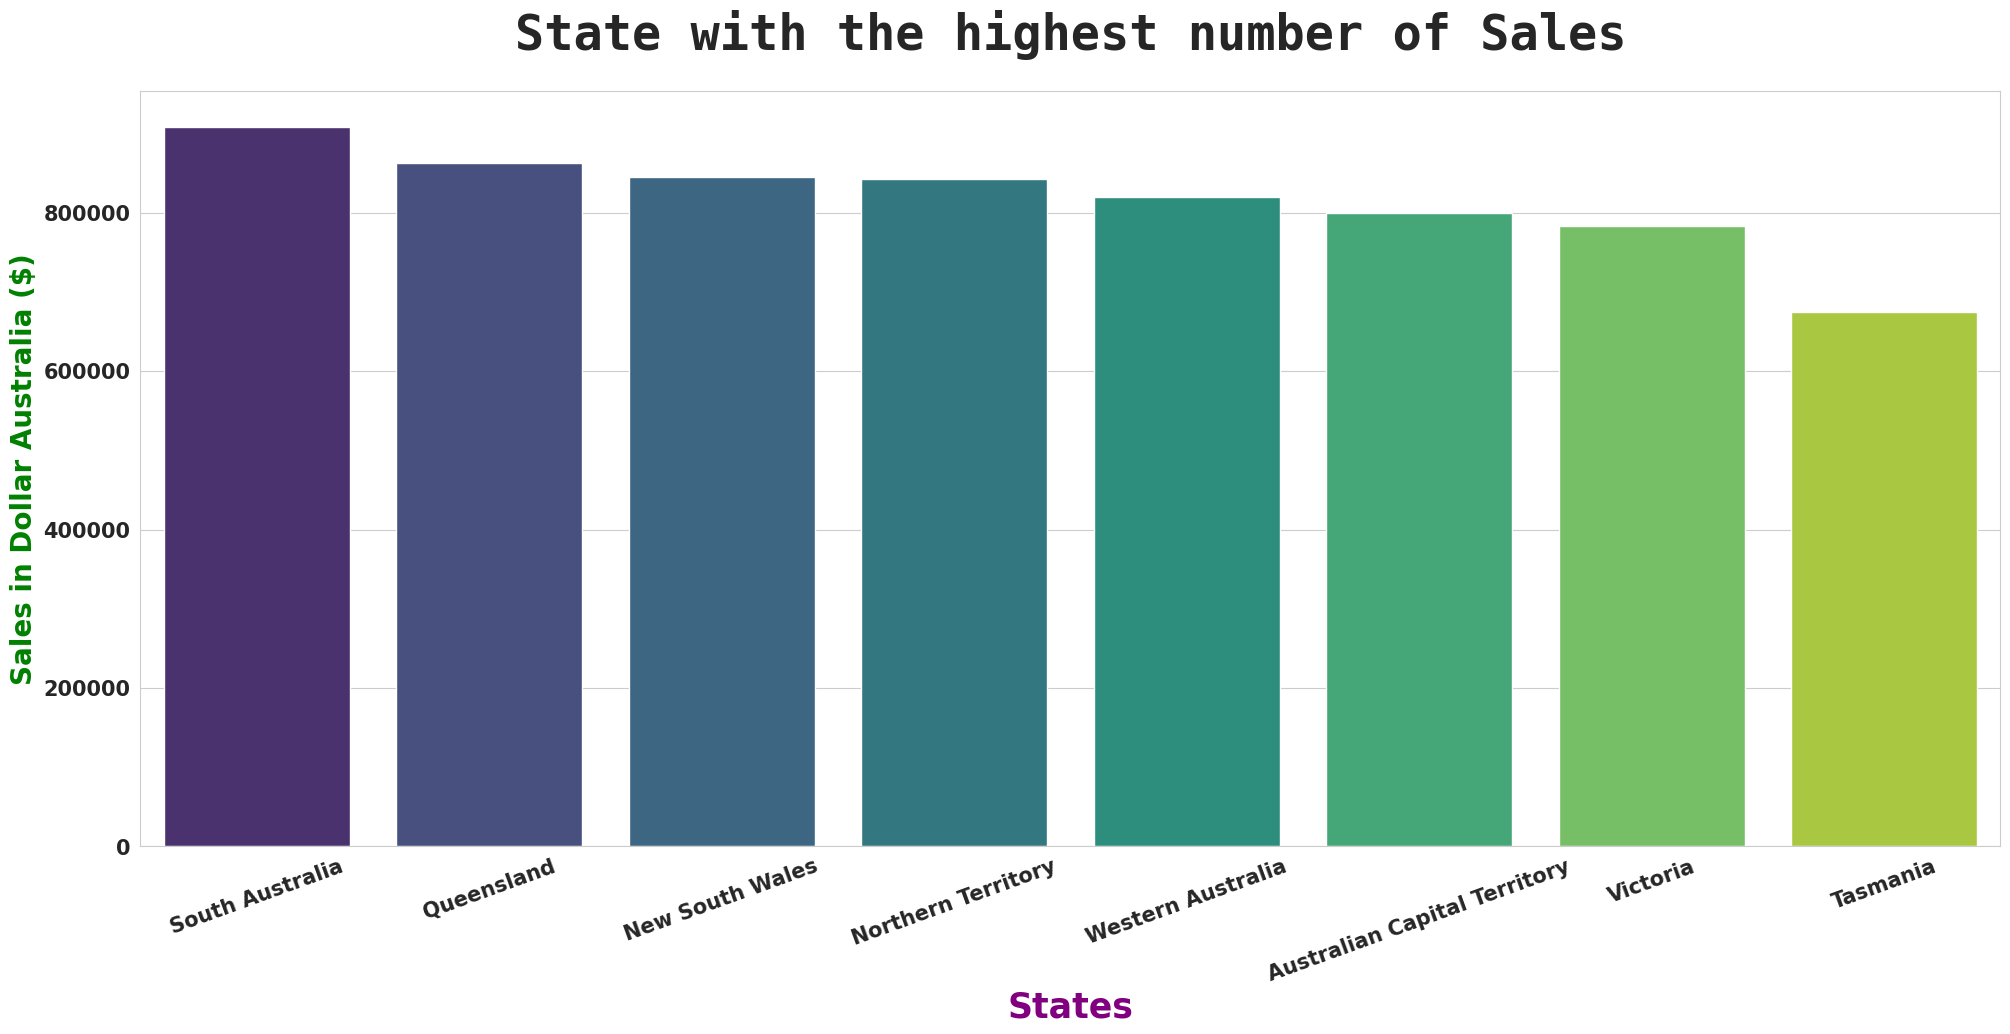
- state : 8 uniqueness variable(s)
- country : 1 uniqueness variable(s)
- order_date : 291 uniqueness variable(s)
- delivery_date : 305 uniqueness variable(s)
- product_type : 3 uniqueness variable(s)
- product_name : 28 variable(s) of uniqueness
- size : 5 uniqueness variable(s)
- color : 7 uniqueness variable(s)
- description : 1000 variable(s) of uniqueness
-
Sales data:
- There are no missing values
- There are no uniqueness values
All data types in this data are Int 64. Next, we will try to do some explorations and visualizations.
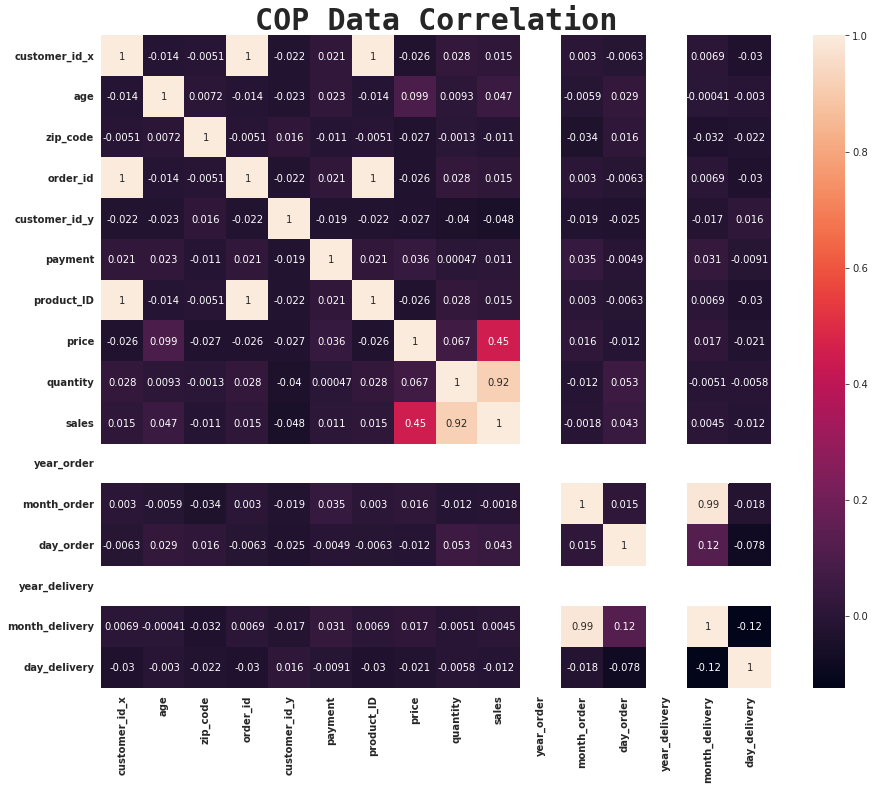
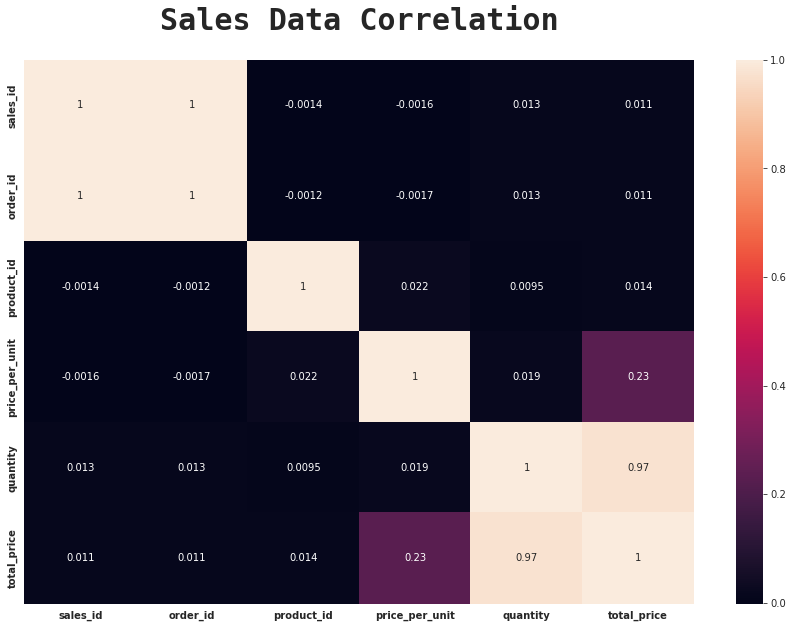
By printing the data it’s possible see the correlation value is between -1 and 1. The closer the values are to 1 or -1, the greater the correlation. Exactly 1 or -1 represents perfect correlation. 0 represents no correlation.
Note: NaN is expected if the values do not vary. To understand why, take a look at the correlation formula:
If the values of variables i or j do not vary, the respective standard deviation will be zero and so will the denominator of the fraction. Therefore, the correlation will be NaN.

We can see that some features appear to be highly correlated with each other.
For instance:
- Sales and Price are highly correlated meaning one affects the other.
- If the price is high, sales will go down and vice-versa.

Find the proportion that lies in between two standard deviation (
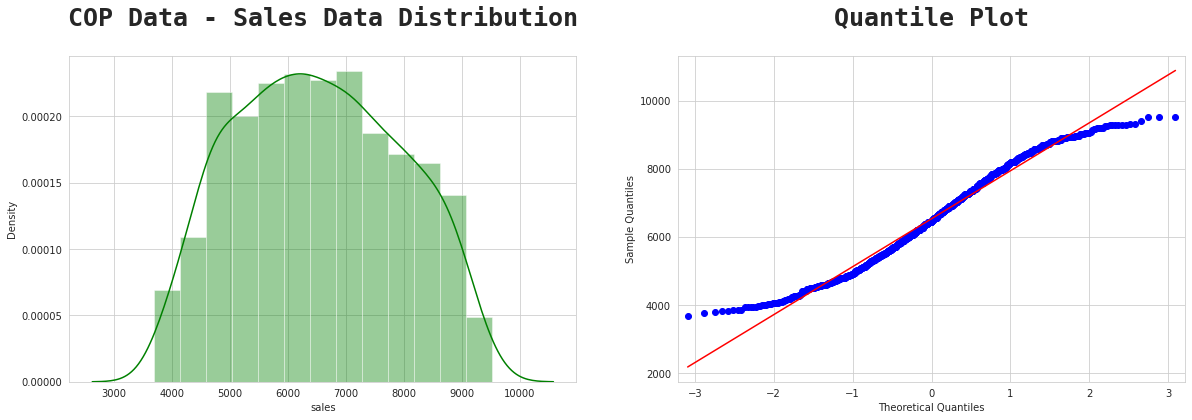
In the Sales Data, the
Calculation:
-
6533−2(1409)=3715
-
6533+2(1409)=9531
i.e the mean minus 2 standard deviation and the mean plus 2 standard deviation.
Interpretation:
At least 75% of the Shopping Cart Database Sales customer population in Australia has sales ranging from 3715−9531 (Australian Dollars).

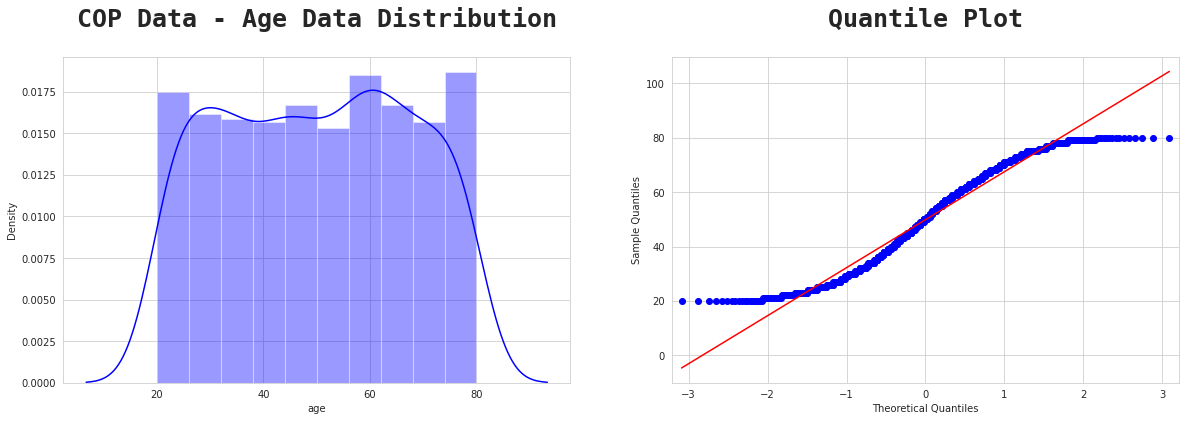
Find the proportion that lies in between two standard deviation (
Calculation:
-
49.8−2(17.6)=14.59
-
49.8+2(17.6)=85.0
Interpretation:
At least 75% of the Shopping Cart Database customer population in Australia has an age range of 14−85 years.

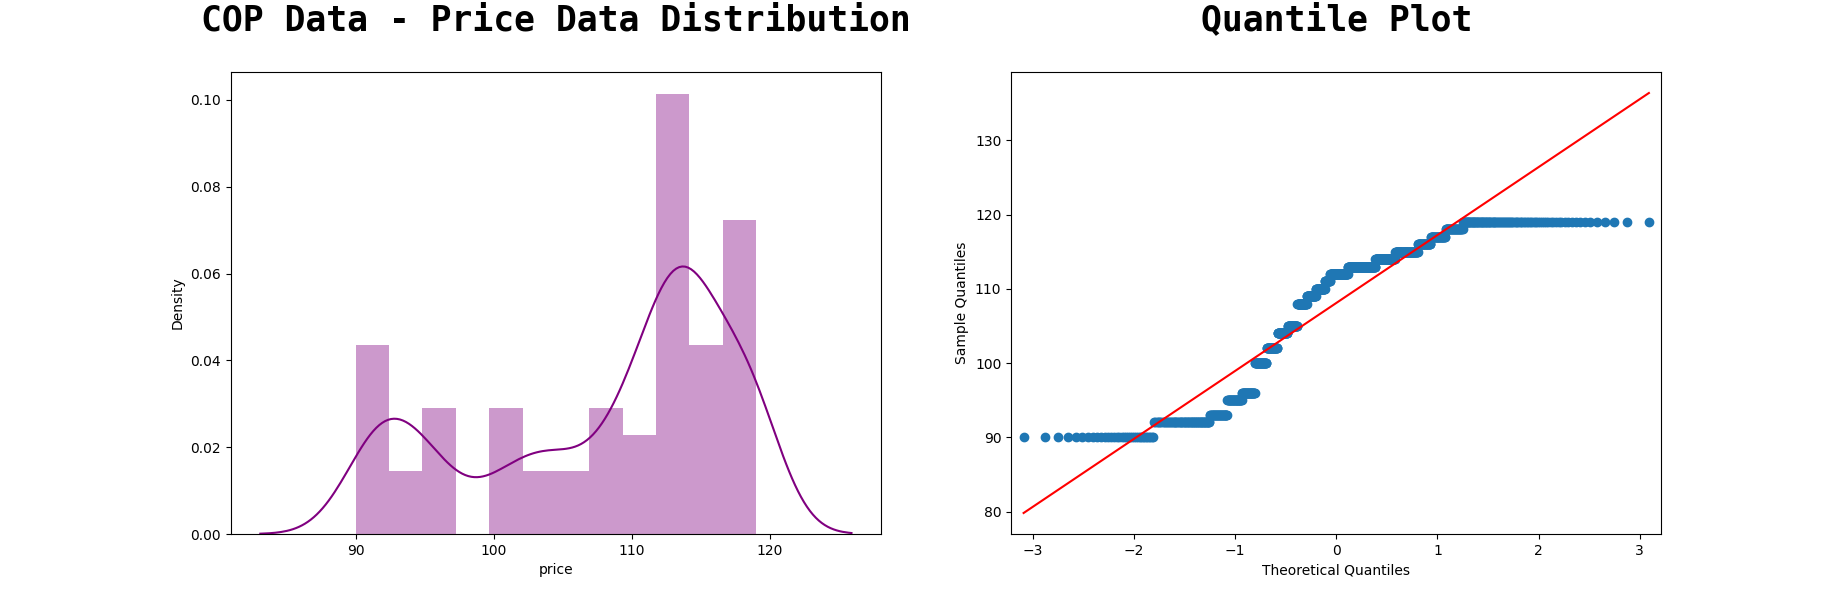
Find the proportion that lies in between two standard deviation (
Calculation:
-
108.095−2(9.15)=89.795
-
108.095+2(9.15)=126.395
Interpretation:
At least 75% of Shopping Cart population in the product price database in Australia has a price range from 89,795−126,395 (Australian Dollars).

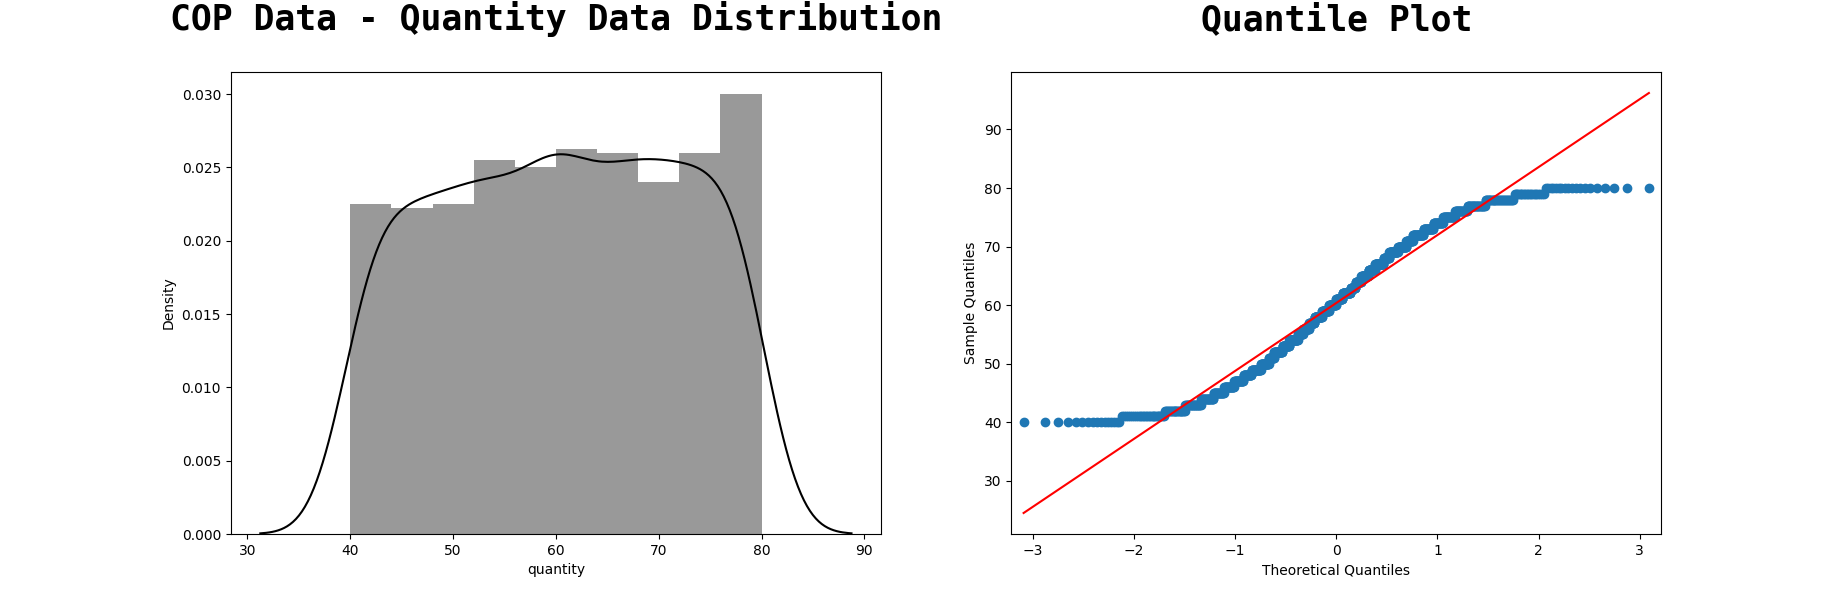
Find the proportion that lies in between two standard deviation (
Calculation:
-
60.3−2(11.6)=37
-
60.3+2(11.6)=83.5
Interpretation:
At least 75% of the Shopping Cart Database Quantity ordered population in Australia has a quantity range from 37−83.5 quantity ordered.

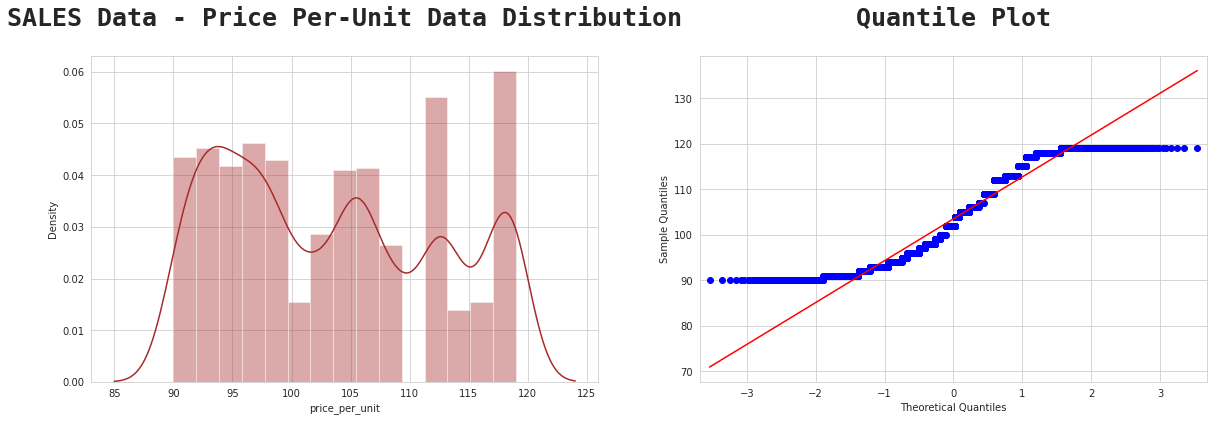
Find the proportion that lies in between two standard deviation (
Calculation:
103.5−2(9.1)=85.3
103.5+2(9.1)=121.7
Interpretation:
At least 75% of the population of the Shopping Cart Database, the per unit price range is in between 85.3 to 121.7 (Australian Dollars).

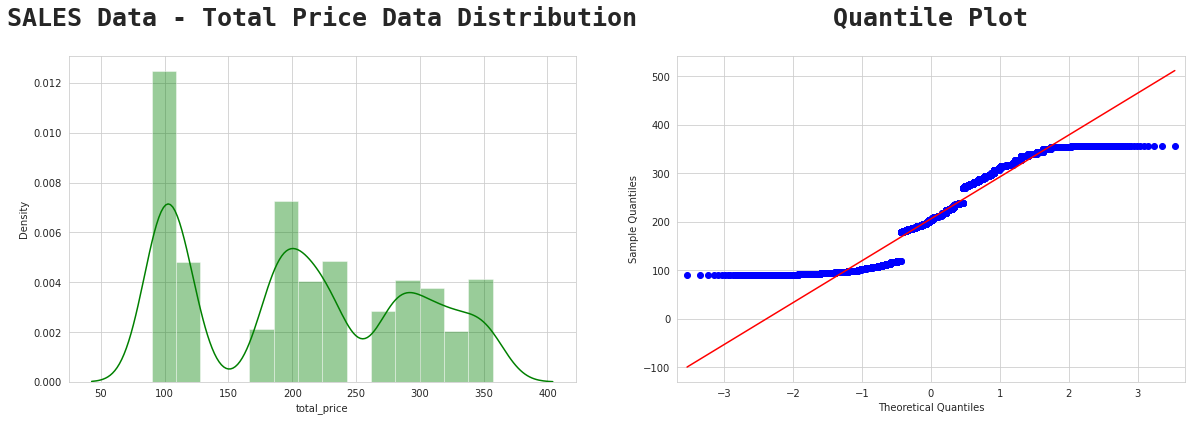
Find the proportion that lies in between two standard deviation (
Calculation:
206.3−2(86.3)=33.7
206.3+2(86.3)=378.9
Interpretation:
At least 75% of the sales data has a total price range from 33.7 to 378.9 (Australian Dollars).

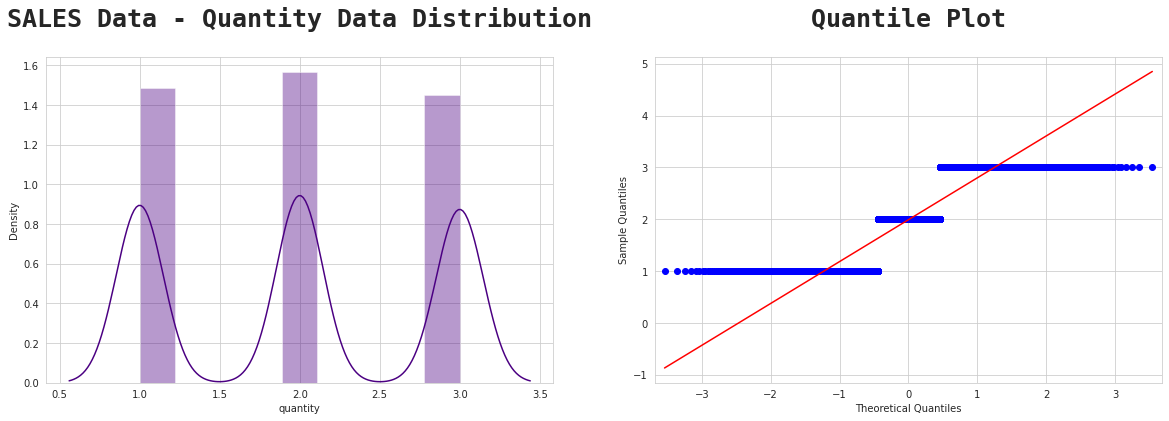
Find the proportion that lies in between two standard deviation (
Calculation:
2−2(1)=0
2+2(1)=4
Interpretation:
At least 75% of the population of Shopping Cart Database Quantity ordered in Australia has a total quantity range from 0−4 quantity ordered.


Read more about the different types of gender here

Quite suprising how male managed to shop more than females…lol

South Australia took first place with the highest total sales of 907.400 (Dollar Australia), and Queensland took second place with sales of 862.965 (Dollar Australia).

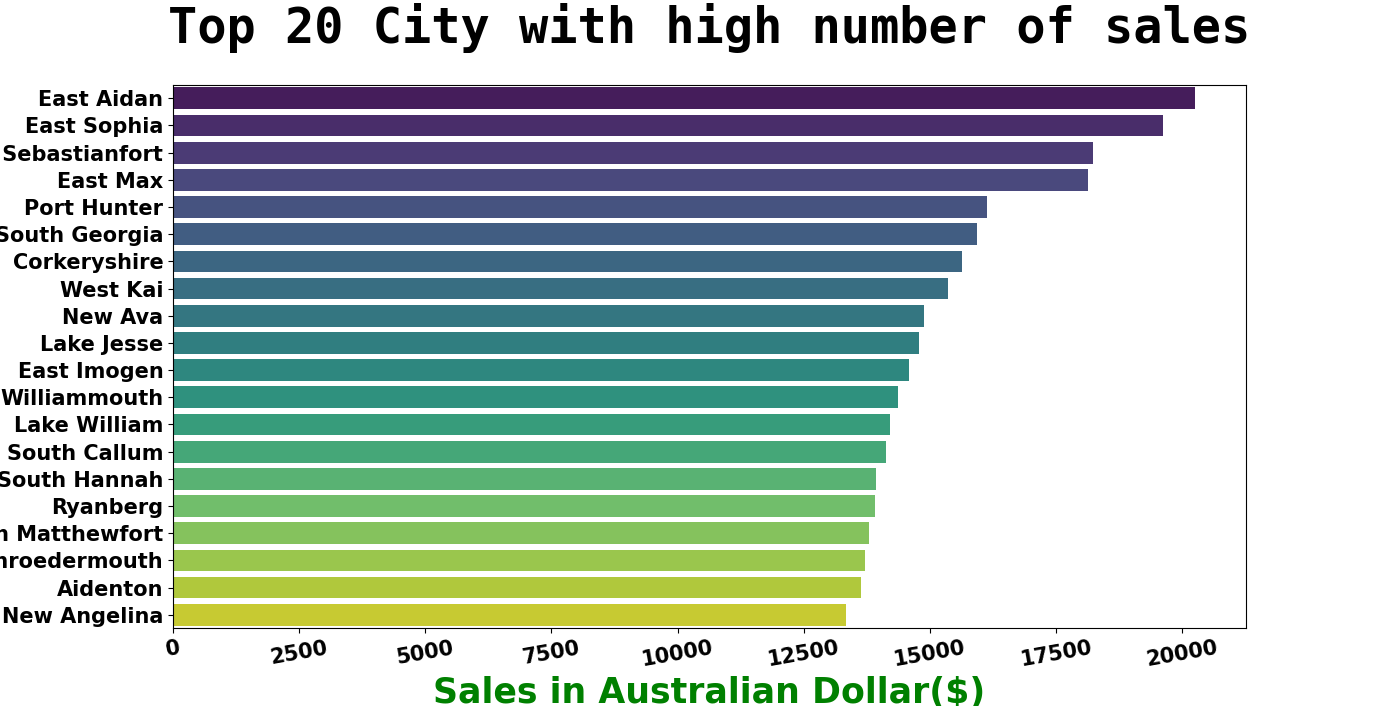
East Aidan occupies the first position in the city with the highest number of sales with total sales of 20.247 (Dollar Australia), and the second position is occupied by East Sophia with total sales of 19.628 (Dollar Australia).
Enjoy 2F
 https://github.com/F-a-b-r-i-z-i-o/Analysis_of_Shopping_Cart_Data
Leave a Reply